Global Green Conducts GIS Analysis to aid Neighborhood Resilience Project in New Orleans
LAUREN ANDERSON MAY 23, 2019
As a GIS and Mapping Volunteer with Global Green, I was asked to map the Lower Ninth Ward and Holy Cross neighborhoods in New Orleans, Louisiana to aid in a Neighborhood Assessment and Neighborhood Resilience Project. For these maps, we decided to visualize FEMA Flood Risk, the zoning codes for the neighborhoods, and elevation. FEMA’s National Flood Hazard Layer (NFHL) is shown in these neighborhoods as having a 1% Chance Annual Flood Hazard and a 0.2% Chance Annual Flood Hazard. The 1% Chance Annual Flood Hazard areas have a higher risk of experiencing annual floods than the 0.2% Chance Annual Flood Hazard areas. FEMA explains the 1% risk as an area vulnerable to a 100 year flood and 0.2% risk as an area vulnerable to a 500 year flood (this is where the percentage comes from). As seen in the maps below, both of the neighborhoods are considered vulnerable to flooding, with the Northeastern portion of the Lower Ninth Ward having the greatest risk.
In some of the earlier maps I created, I included each of the zoning districts outlined by the City of New Orleans. As I attempted to visualize multiple layers on the maps, symbolizing so many types of zoning districts made it difficult to clearly display. Because of this, I simplified the zoning districts into: Business Districts, Commercial Districts, Industrial Districts, Mixed-Use Districts, Neighborhood Open-Space Districts, and Residential Districts. To do this, I added a new field on the attribute table for this Shapefile layer, and sorted each Zoning District into these simplified categories. After this, I changed the symbology to visualize the new Zoning Districts field rather than the provided Zoning Description field (this included names for the city zoning codes).
With the exception of the USGS Digital Elevation Model (DEM), the other layers were clipped within the two neighborhoods’ limits, and merged to create one layer. Elevation was the most difficult to symbolize, as the elevation does not vary much within these neighborhoods. Because of this, I created contour lines to signal a two foot change in elevation. Additionally, the layers were projected to the NAD 1983 StatePlane Louisiana South FIPS 1702 Feet. These neighborhoods are prone to flooding so future resilience projects may aim to try to combat flooding to prevent further damage or devastation. These neighborhoods contain many historic districts, as well, which are likely valuable beyond their economic worth. Protecting these neighborhoods is beneficial to the vulnerable residents living here and to the City of New Orlean’s in protecting their cultural heritage.
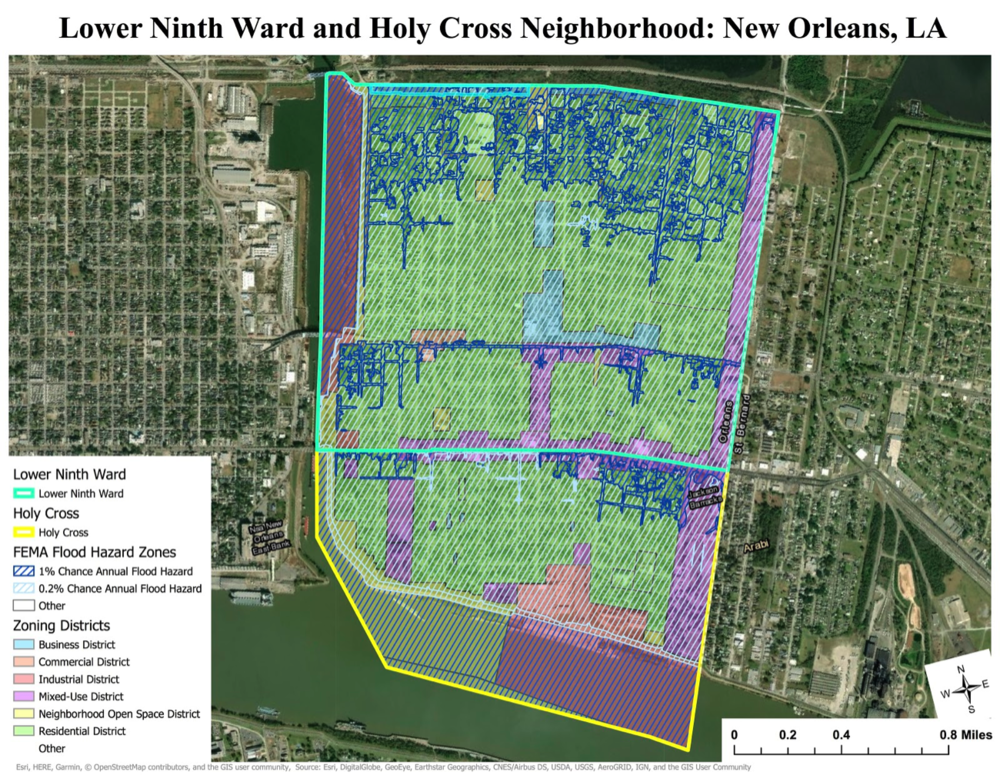
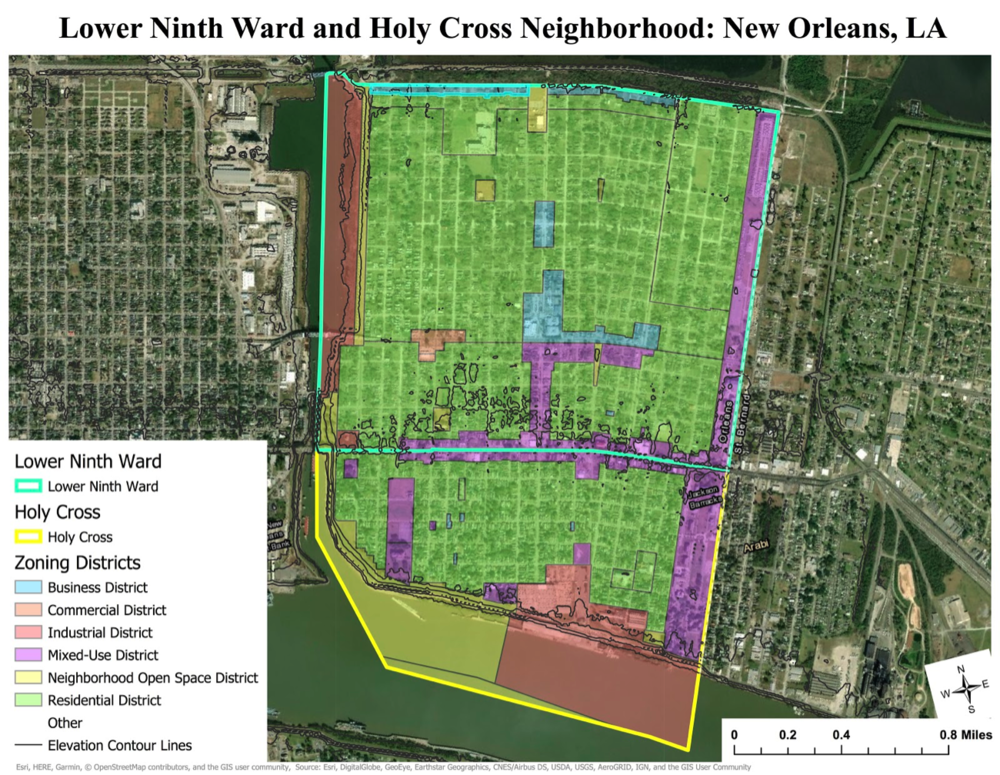
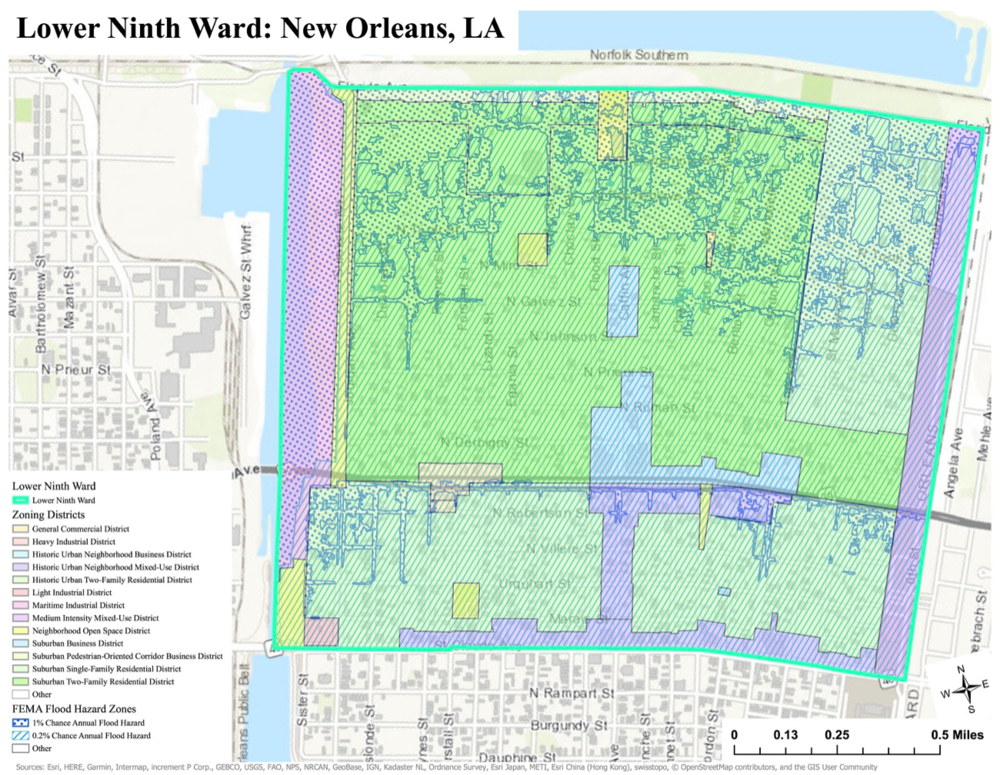
The map above shows the FEMA Flood Hazard Zones overlapping with the simplified Zoning Districts and neighborhood boundaries. The majority of the neighborhood is residential, with industrial and commercial districts mainly located near the water and mixed-use/business districts distributed throughout the neighborhoods. There are a few neighborhood open space districts, which could be a good location for future projects.
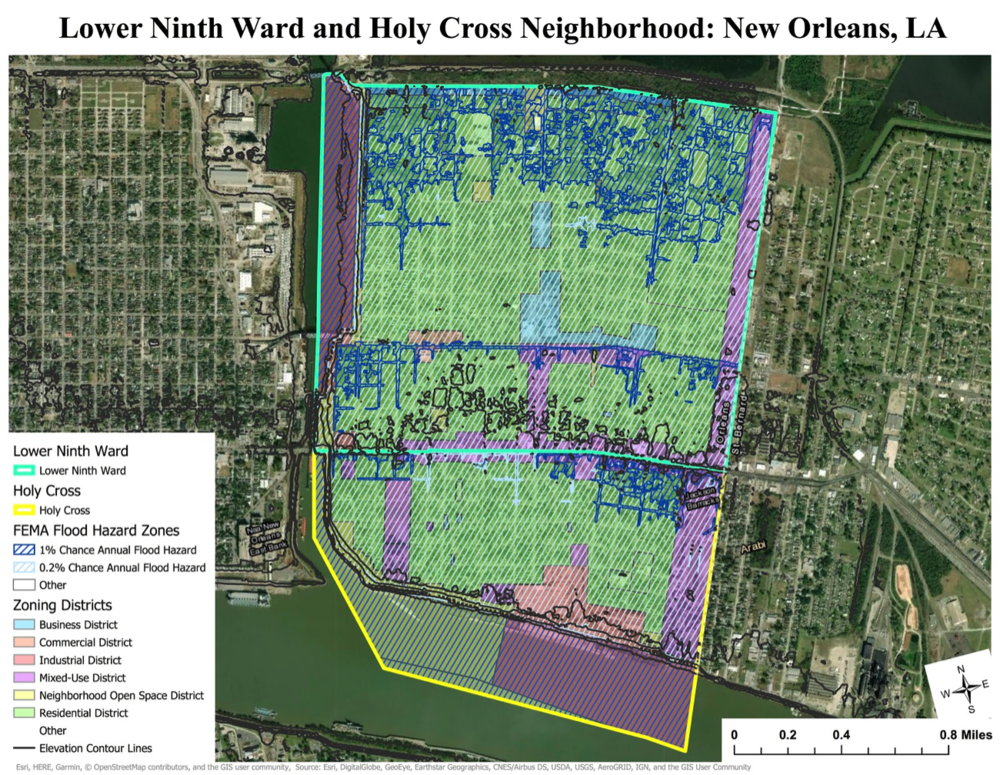
This map displays similar information as the last, but including the contour lines that signal a two foot change in elevation. This layer is not quite as useful for visually representing elevation changes on such a large (local) scale, but it is a simple representation that overlaps better with the existing Zoning Districts, Flood Hazard Zones, and neighborhood boundary layers.
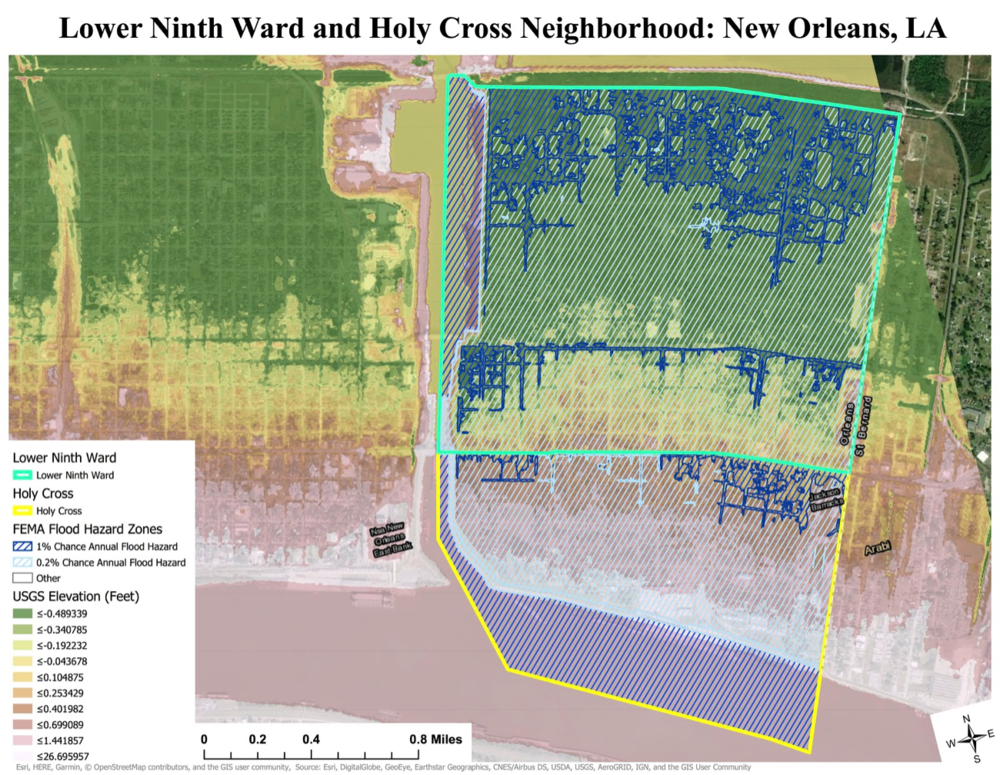
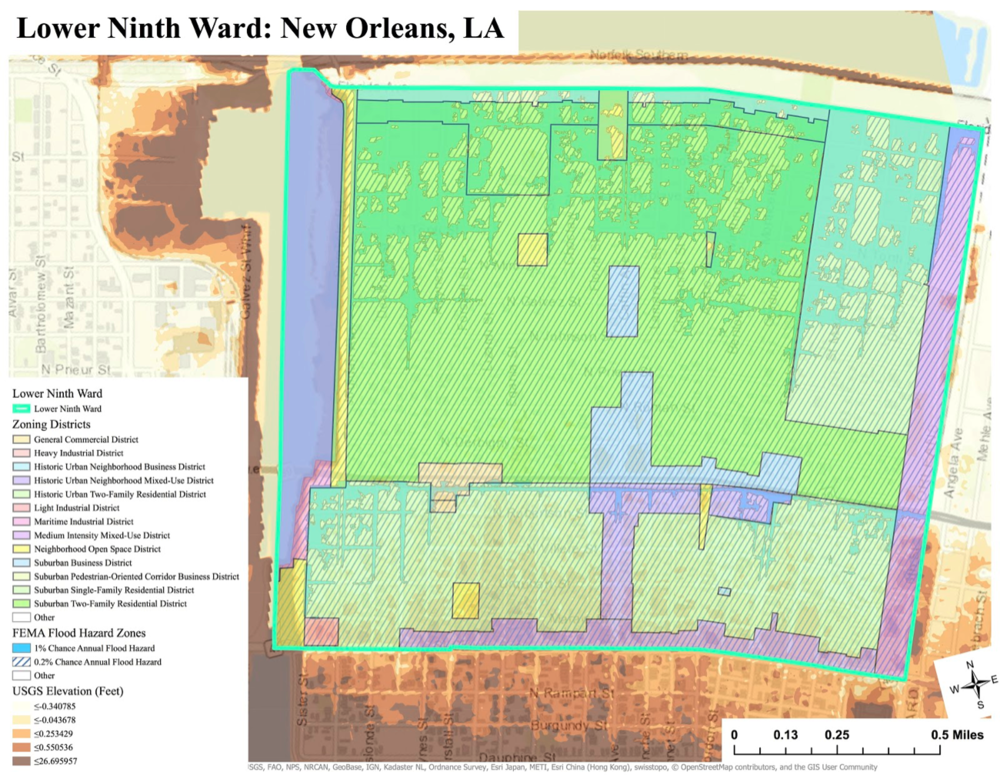
As seen in the map above, the majority of these neighborhoods show minor elevation changes. I classified these changes with ten classes and using Natural Breaks classification, meaning that the classes representing elevation height are grouped where the elevation data groups naturally within the data set. This map leaves out the Zoning Districts, as this layer is difficult to symbolize and represent with the elevation layer.
This map leaves out the FEMA Flood Hazard Zones, instead giving a clearer view of the zoning and still signally the elevation changes with contour lines.
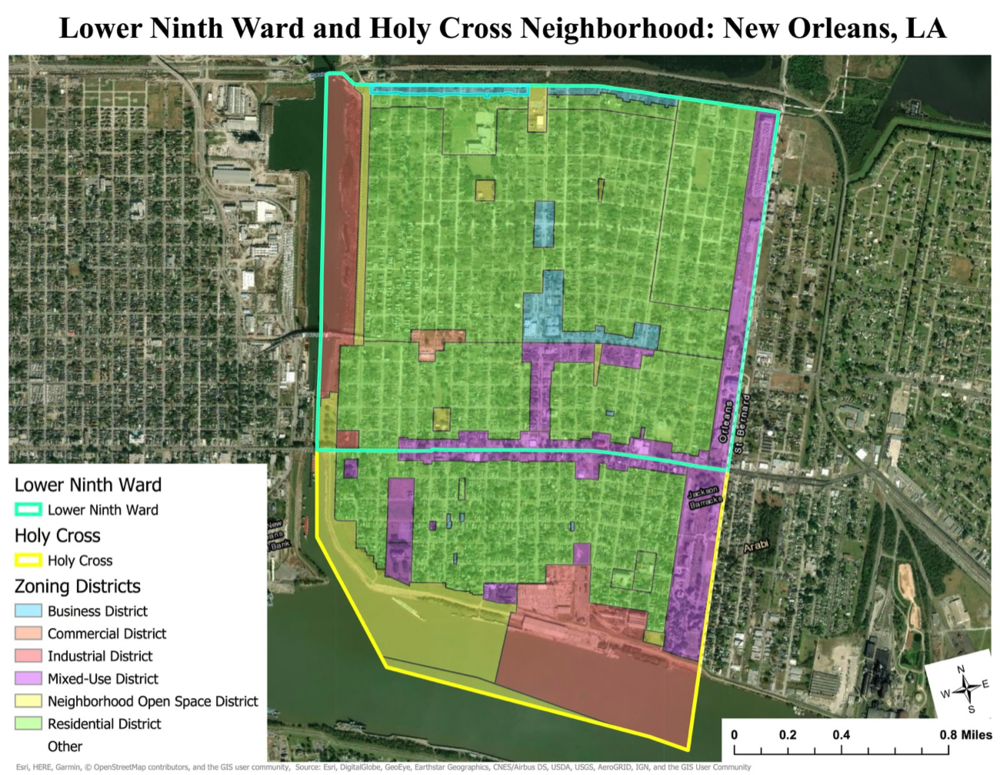
Similarly, this map represents the neighborhood boundaries and Zoning more clearly, without the other layers (Flood Hazard Zones, Elevation) filling up the map.
This map shows one of my early attempts to symbolize elevation (in five classes this time, using Natural Breaks classification) and displays the original Zoning Districts before I simplified them. It is rather difficult to see any of the layers clearly here because so many are visualized together.
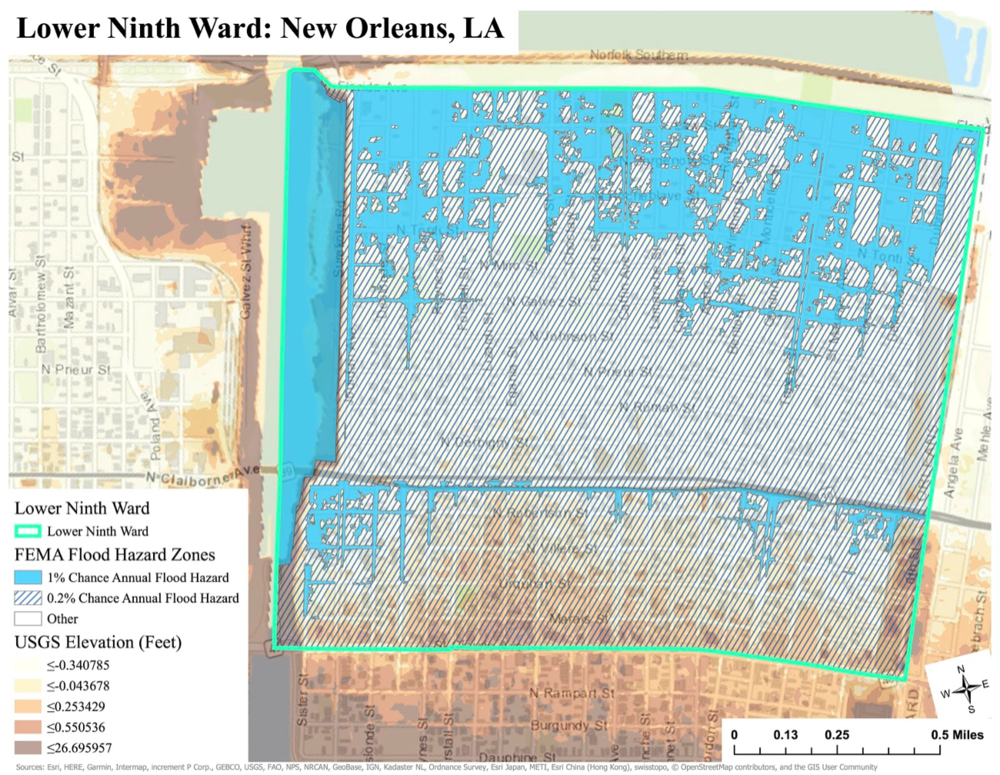
Because it was difficult to see Zoning Districts on the last map, I removed them, instead showing elevation with the Flood Hazard Zones. It seems as though the Flood Hazard Zones do correspond with lower elevations, but these neighborhoods are likely at great risk due to their close proximity to the surrounding bodies of water: the Mississippi River, the Turning Basin, and Main Outfall Canal in New Orleans.
The problems previously mentioned are present here, as well; the Zoning Districts were difficult to overlay with any other layers, as there were so many districts to visualize. I tried to make each of the similar Zoning Districts different shades of the same color. For example, Residential Districts are visualized with different shades of green. It still is not very clear, but the layer was made transparent to be able to see the neighborhood itself beneath the layer (at least partially).
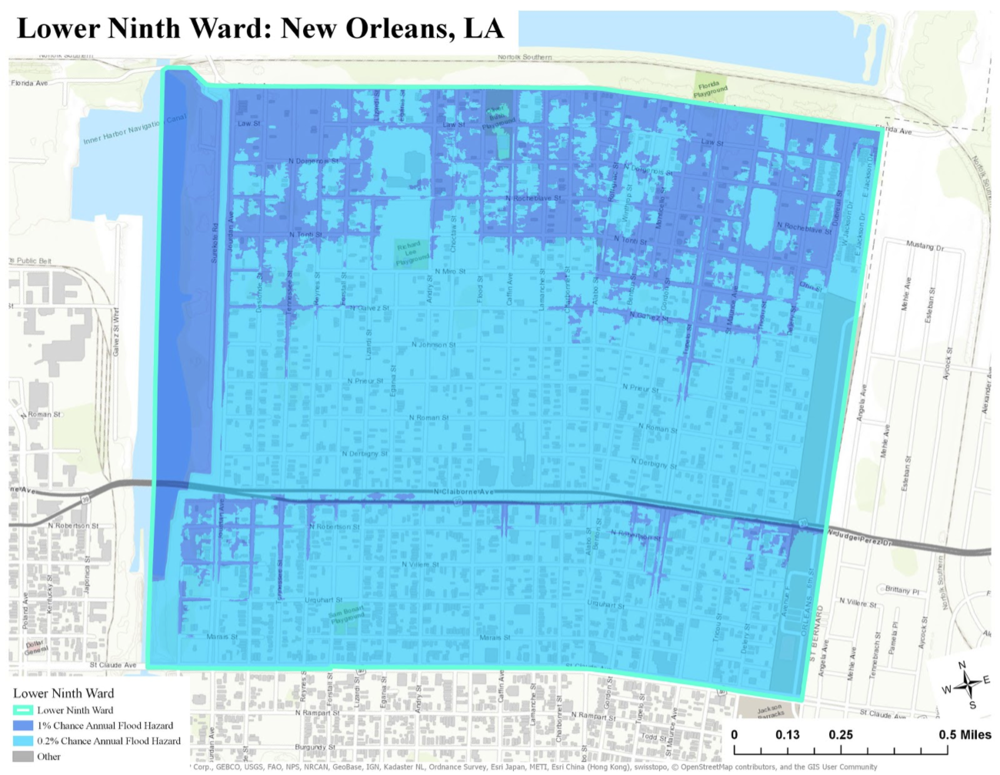
When I was able to obtain the Flood Hazard Zones, this was the first map that I created to clearly show the flood risk areas without the Zoning Districts or Elevation layers making this layer more difficult to see.
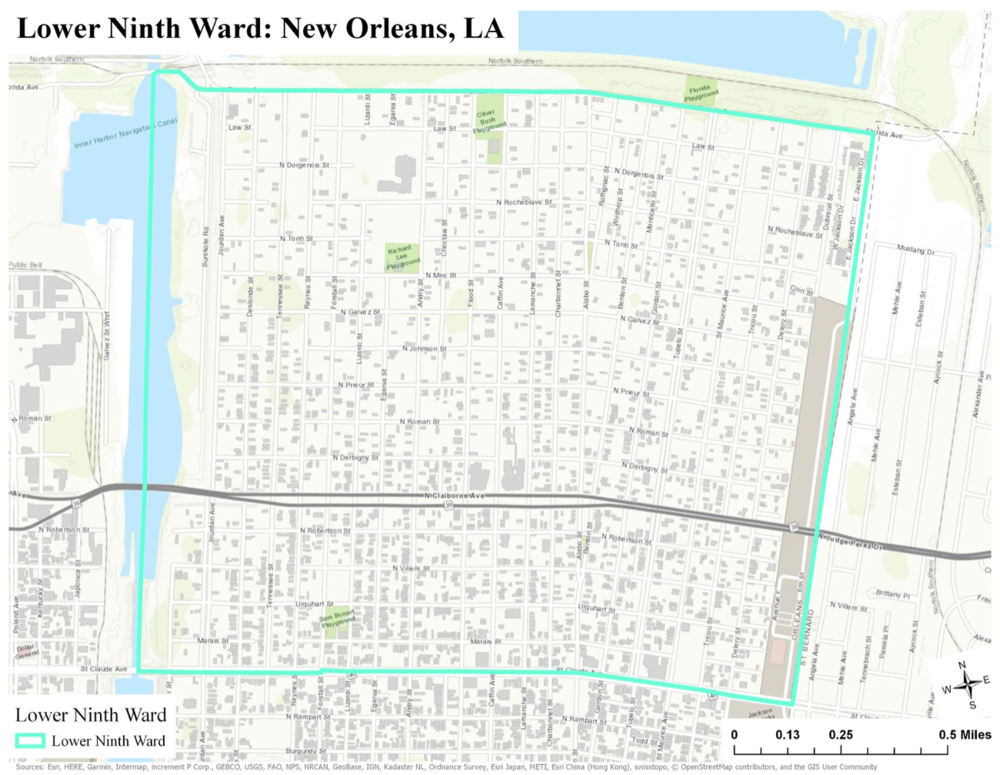
This simple map shows the Lower Ninth Neighborhood boundary, of course before adding the Holy Cross Neighborhood boundary later on.
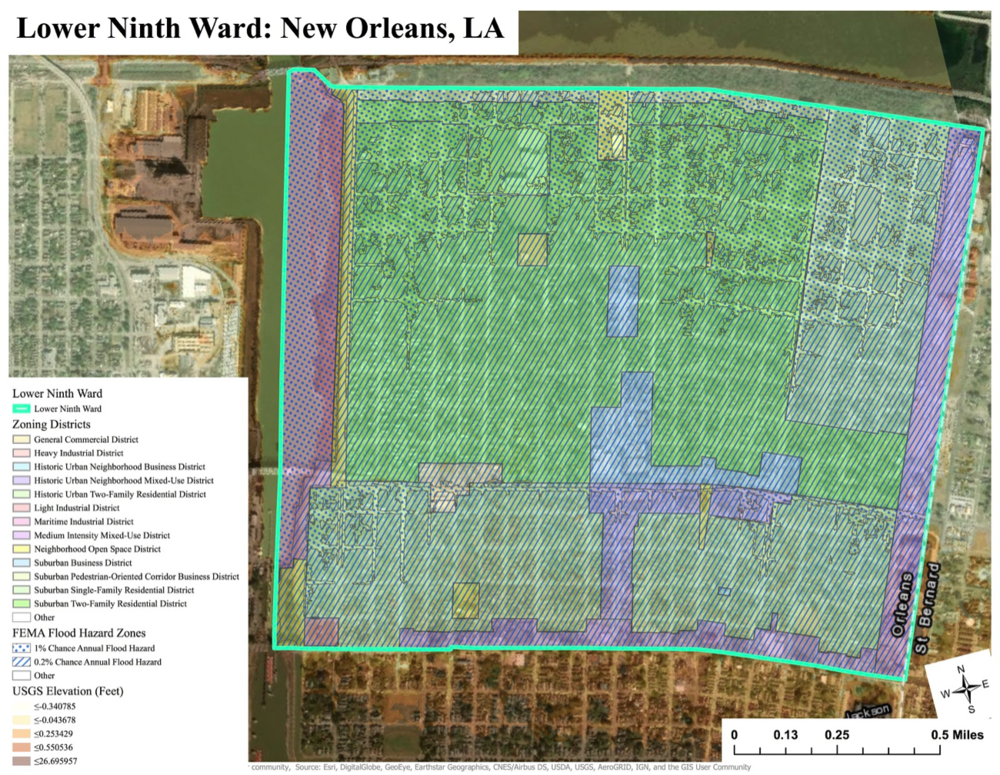
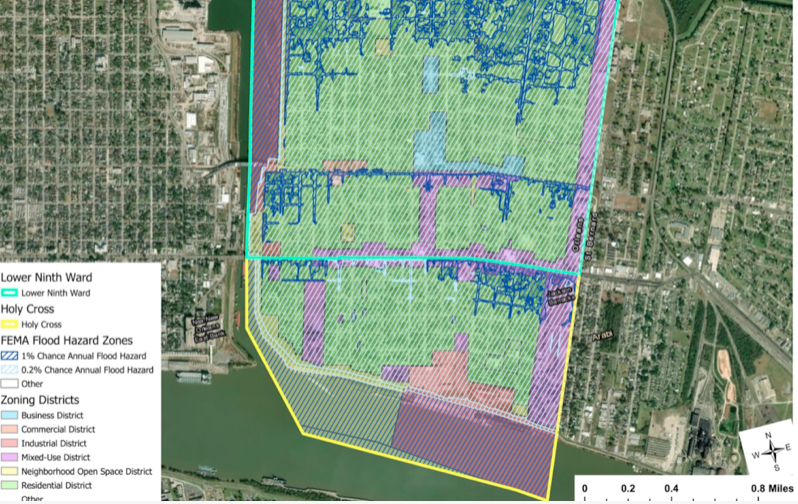
For this map, I tried to add each of the layers and change to the Satellite Imagery base map to show the features of the neighborhood. Unfortunately very little of the neighborhood can be seen below, as the other layers over it prevent a clear view of the streets or buildings.
References
City of New Orleans. “City of New Orleans Open Data Portal” City of New Orleans GIS, 2018, portal-nolagis.opendata.arcgis.com/.
Data Center. “Lower Ninth Ward Statistical Area” Data Center Research,19 Apr.2019, https://www.datacenterresearch.org/data-resources/neighborhood-data/district-8/lower-ninth-ward/
Federal Emergency Management Agency. “FEMA’s National Flood Hazard Layer (NFHL)” Department of Homeland Security, 2019, https://hazards-fema.maps.arcgis.com/apps/webappviewer/index.html?id=8b0adb51996444d4879338b5529aa9cd
United States Geological Survey. “The National Map Viewer” 2015, https://viewer.nationalmap.gov/basic/


